
Guide · 18.11.2026
How to submit and track a business registration in France
Prepare documents for France’s Guichet unique, check the signature and fees, and respond if the reviewing authority asks for a correction.
Read storyUseful journalism to understand, manage and grow a business.
SearchA practical guide to studying demand, comparing competitors, and analyzing industry forces using public sources—without confusing clues with evidence.

Market research and competitive analysis answer different questions. The first helps you understand who might buy, what needs they have, where they are, and how much they pay for alternatives. The second examines which businesses—and other options—are seeking to serve those customers and what conditions influence competition.
For a small business, keeping these concepts distinct prevents a list of rivals from taking the place of research into demand. There may be many similar businesses and, even so, it may not be clear which segment is interested in a particular offering. Demand may also exist, but reaching customers or differentiating your business from available alternatives may be difficult.
The U.S. Small Business Administration (SBA) guide recommends studying, among other things, demand, market size, relevant economic indicators, customer locations, market saturation, and the prices of alternatives. It also recommends identifying competitors by product or service line and by market segment. Its statistical resources and examples focus on the United States; outside that country, look for equivalent data from organizations and sources in the territory where the business operates.
Existing sources can help answer general, quantifiable questions, such as how an industry is evolving, demographics, or household incomes. Their advantage is that they let you make progress without conducting direct research from the outset; their limitation is that they may not describe the business’s specific audience in enough detail.
To learn about reactions to an offering, a buying experience, or a brand, the SBA identifies direct research methods such as surveys, questionnaires, focus groups, and in-depth interviews. These methods can provide more specific information, although they require time and resources. The choice depends on the question: asking potential customers about a specific need is not the same as measuring general industry trends.
Before collecting data, formulate the question you need to answer. For example, “What alternatives does this segment consider when looking for this service?” is more useful for guiding research than “Who are our competitors?” without defining the product, customer, or area.
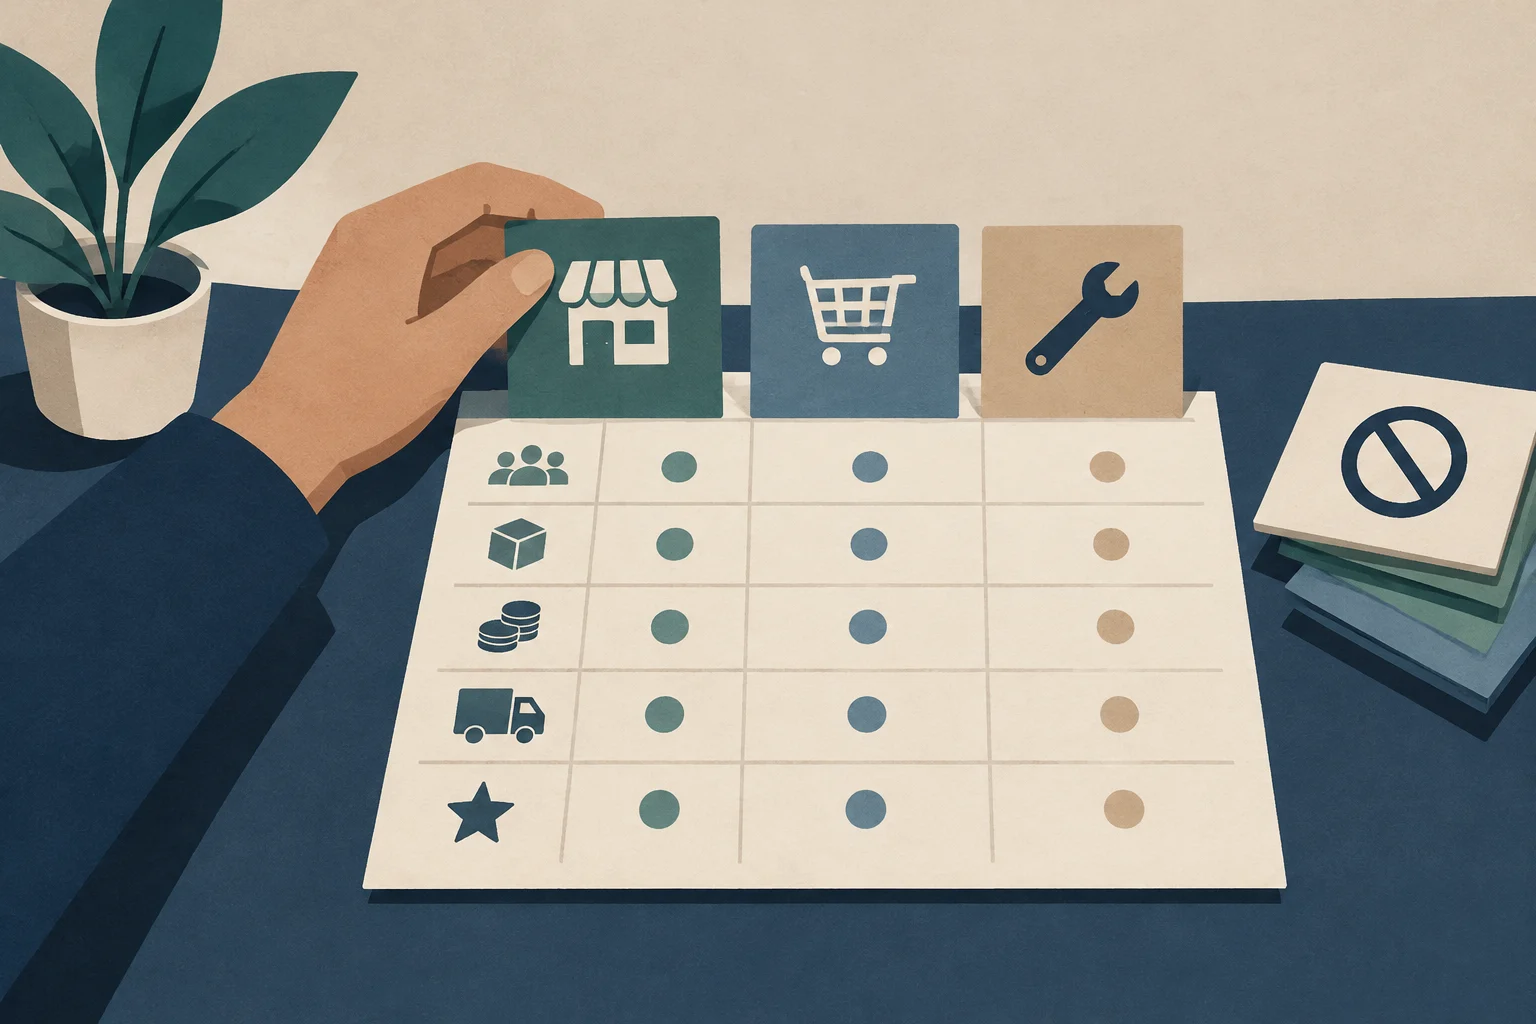
A matrix helps organize observations consistently. Include direct competitors, which offer a comparable solution to the same audience, and indirect competitors, which address the same need in another way. Also include the option of not buying or solving the problem independently, where relevant.
| Field | What to record |
|---|---|
| Business or alternative | Name and type: direct, indirect, or another relevant option |
| Segment and area | Which audience it appears to target and in which territory it operates |
| Offering | Observable products or services and the needs they address |
| Price and terms | Published price, unit, date, and visible terms; note if unavailable |
| Access and distribution | Sales channels or ways of contracting that can be verified |
| Observable strengths and limitations | Verifiable characteristics, not impressions presented as facts |
| Source and date consulted | Where each piece of data was found and when it was reviewed |
Record only what you can substantiate. If a characteristic is an impression—for example, that an offering seems more convenient—identify it as a hypothesis and note what observation prompted it. If prices are not comparable because they include different features or terms, do not present them as a direct comparison.
The Porter’s Five Forces framework, explained by Harvard Business School’s Institute for Strategy and Competitiveness, helps examine how economic value is distributed within an industry. It is not simply a list of rivals: it also considers suppliers, customers, substitutes, and the possibility of new entrants.
The forces help frame questions about an industry; they do not replace data about a specific business. In addition, an industry’s structure can change: technology, regulation, innovation, or competitors’ decisions can alter barriers and the intensity of competition. For that reason, record when you conducted the analysis and review relevant assumptions when conditions change.

A matrix and the five forces organize information, but they do not, by themselves, prove that an opportunity will be profitable. Before making a decision, distinguish three levels:
SWOT analysis can be useful at the end to organize internal strengths and weaknesses alongside external opportunities and threats. It is a synthesis, not a source of evidence: each item should refer to data or be identified as an assumption that remains to be tested.
A useful hypothesis specifies what you expect to observe and how you will test it. For example, a business might propose, as a hypothetical exercise: “People looking for this service value a faster response more than a wider range of options.” It could test this through interviews or a survey of potential customers, as well as by reviewing what information alternatives make public. The result should not be treated as confirmed just because some responses match the initial expectation.
Prioritize public sources and transparent methods. Clearly identify who is conducting a survey or interview and why responses are being collected; avoid obtaining information through deception or trying to access confidential data. Record the origin of the data and do not attribute characteristics to a business that you cannot verify.
These guidelines are general research principles, not legal advice. Obligations concerning data, commercial communications, intellectual property, and other matters depend on the country and the activity. If the work raises a specific legal question, check the rules applicable in the relevant territory.
A useful competitive analysis is not one that accumulates the most names, but one that makes unanswered questions clear and connects each decision to the available evidence. Summarize which segments appear relevant, which alternatives compete for them, which forces could affect the industry, and which hypothesis is worth testing first.
To keep the analysis practical, retain the source, date, and degree of certainty alongside each finding. This makes it easier to distinguish a real market change from an outdated impression and to update decisions when new information becomes available.
For a business serving the US market, first define who might buy, in which area and to meet which need. The SBA recommends combining existing information with direct research. Write a testable question, such as what a customer uses today and why they might switch.
Use County Business Patterns to understand establishments with paid employees by industry and geography. Record the year, area, classification and coverage. An establishment is a statistical unit, and the count does not represent every business or every competitor. To understand potential customers’ context, consult American Community Survey data. The guide to choosing one-year or five-year estimates explains their differences in precision and coverage. A five-year estimate combines observations over that period. Check margins of error and compare areas using compatible periods and definitions.
Add interviews about recent purchases, alternatives and difficulties. Ask for concrete examples, avoid suggesting an answer and record how each participant was recruited. Responses from acquaintances or a small group provide hypotheses to test. They do not automatically justify applying a percentage to the whole population.
In a fictional exercise, an advisory firm assumes it could reach 1,000 businesses and that 3% would buy, producing 30 hypothetical customers. Neither the reachable population nor that percentage comes from a survey here. Try lower and higher scenarios, compare them with capacity, costs and prices, and define what evidence would change the decision. Keep a record of the question, source, date, limitation and next test before adding the finding to your competitor matrix.
Prepare documents for France’s Guichet unique, check the signature and fees, and respond if the reviewing authority asks for a correction.
Read story
A first guide to starting a business in Germany. Check which steps may apply, make a cash forecast and find advice in Mössingen and Unterallgäu.
Read story
A practical guide for site directors and prevention technicians on the drafting, approval, and updating of the Health and Safety Plan (HSP) in Spain. It analyzes the difference from the Safety Study, the legal requirements of Royal Decree 1627/1997, and protocols for serious risks.
Read story