Beyond the Miles: How to Calculate the True Profitability of a Transport Route
The average cost per mile in the U.S. fell to $2.260 in 2024, yet truckload sector operating margins plunged to -2.3%. This analysis explains how transport companies must move from a simple metric to a route profitability model that integrates fixed costs, variable costs, and deadhead miles to make informed planning decisions.
The average cost per mile hides true profitability
In the transport industry, the traditional cost per mile metric has been the compass for decision-making for decades. However, the 2025 report An Analysis of the Operational Costs of Trucking, published by the American Transportation Research Institute (ATRI), reveals a concerning reality: the average operating cost of a truck in the United States was $2.260 per mile in 2024, a figure representing a 0.4% decrease compared to the previous year. At first glance, this reduction could be interpreted as an improvement in efficiency. Nevertheless, excluding fuel costs, non-fuel marginal costs increased by 3.6% to reach $1.779 per mile, the highest level recorded by ATRI.
This dissociation between total cost and pure operating costs underscores a critical limitation of the traditional model: the average cost per mile is an aggregated metric that does not distinguish between the profitability of one specific route and another. Two routes can generate the same billing, but one may be highly profitable while the other operates at a loss. The key for fleet managers and traffic controllers lies in transitioning from a global view to a route profitability analysis that decomposes each component of the operating cost.
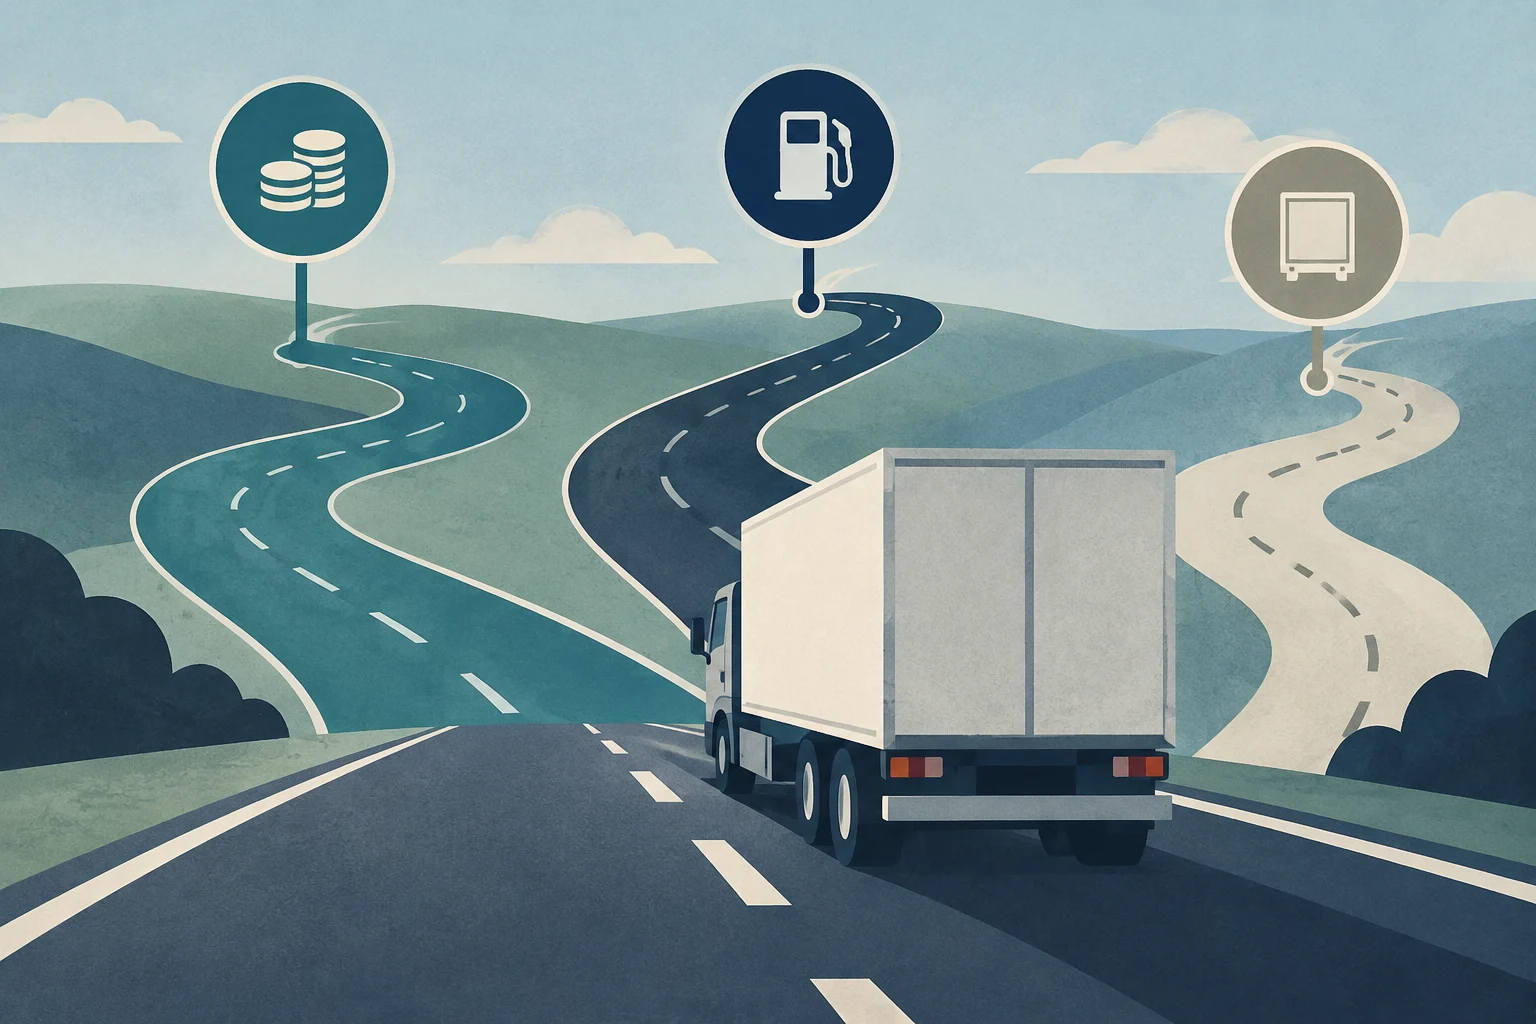
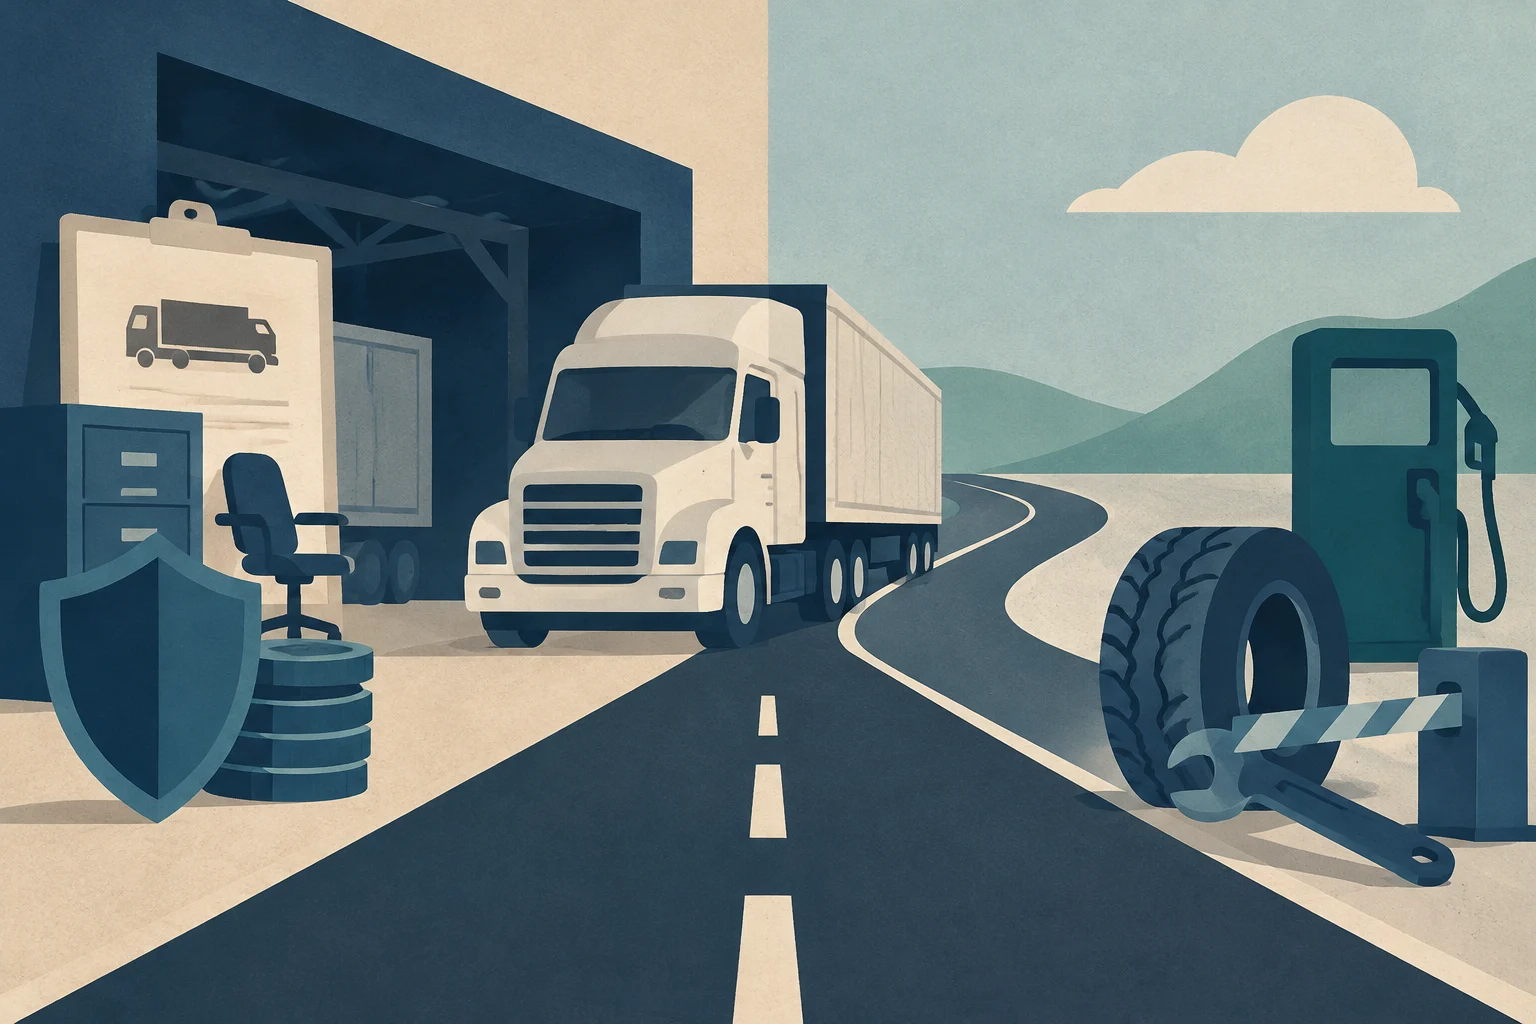
AI-generated conceptual illustration · Edition Business
The distinction between fixed and variable costs
To calculate the true profitability of a route, it is fundamental to separate costs into two categories: fixed costs and variable costs. This distinction is not just an accounting matter, but a strategic tool for planning.
Fixed costs are those incurred regardless of whether the vehicle is in motion or parked. They include:
According to ATRI, in 2024, payments for trucks and trailers increased by 8.3% to reach a record of $0.390 per mile, while driver benefits costs rose by 4.8% to $0.197 per mile. These increases in fixed and semi-variable costs directly pressure profitability, especially in an environment of freight transport recession.
Variable costs, on the other hand, fluctuate based on distance traveled and cargo volume. They include:
Fuel.
Maintenance and repairs.
Tires.
Tolls and parking.
Driver wages (to the extent they are linked to driving hours or miles).
In 2024, fuel costs and repair and maintenance costs decreased compared to 2023, and driver wages, the main driver of costs in the three years following the pandemic, increased by only 2.4%, half a percentage point less than inflation. This moderation in variable costs was not enough to offset the increase in fixed costs, resulting in negative operating margins in the truckload sector (-2.3%).
The impact of deadhead miles
One of the most distorting factors of route profitability is the existence of deadhead miles. These are the miles the vehicle travels without cargo, generally to reposition to an origin point or to return to the base after a delivery. If not correctly allocated to the route cost, profitability is severely underestimated.
The ATRI report notes that deadhead miles increased to an average of 16.7% in 2024, a significant increase reflecting the difficulty companies face in maintaining continuous cargo. A practical example illustrates this problem: if a route has 30 loaded miles and 12 deadhead miles to return to the depot, the total cost must be applied to the 42 total miles. If the company only bills for the 30 loaded miles, the profit margin is eroded by the 12 unbilled miles.
Route optimization through specialized software allows reducing these deadhead miles by planning the delivery sequence more efficiently, avoiding unnecessary movements and improving vehicle utilization.
Methodology for calculating route profitability
To evaluate the true profitability of a route, companies must follow a methodology that integrates all operating costs and compares them with the revenue generated. The process can be summarized in the following steps:
Allocated fixed costs: depreciation, insurance, financing, proportion of administrative costs.
Calculate the total cost per mile of the route:
Sum all costs (fixed and variable) and divide them by the total number of miles traveled (loaded and deadhead).
Compare with revenue per mile:
Divide the total billing of the route by the number of loaded miles (or by the total number of miles, depending on the billing model).
Determine the contribution margin:
Subtract the total cost of the route from the total revenue of the route. A positive margin indicates that the route contributes to covering the company's general fixed costs and generating profit.
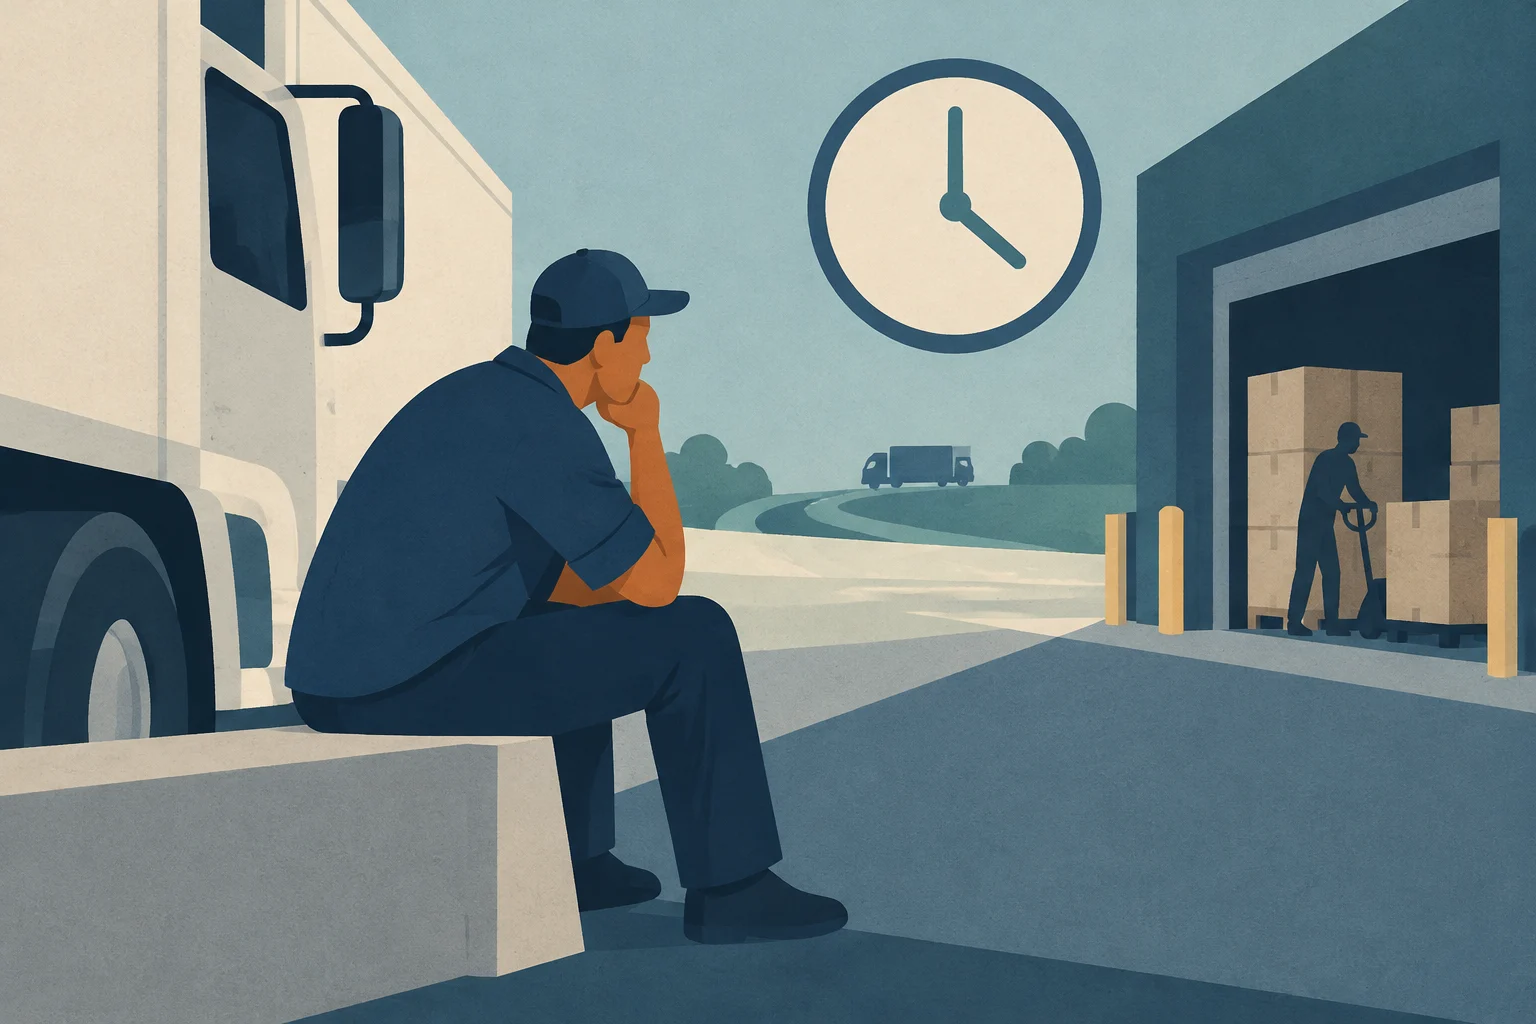
AI-generated conceptual illustration · Edition Business
The role of driving times and driver productivity
In addition to direct costs, driving times and driver productivity are critical factors that impact route profitability. A driver who spends too much time waiting (dwell time) or on administrative tasks reduces the amount of productive miles they can perform in a shift, which increases the cost per mile.
The ATRI report highlights that, despite economic difficulties, the average waiting time per stop improved in 2024, indicating that companies are working to optimize operational efficiency. However, the reduction in the number of drivers per truck to 0.93 (due to vehicle idling) suggests that many companies are operating with less capacity than they possess, which may limit their ability to accept additional loads.
Driver productivity is also affected by fatigue, traffic conditions, and route complexity. Companies that invest in training, telematics tools, and route planning can improve productivity and reduce operating costs.
Strategic decisions based on route profitability
Route profitability analysis is not just a control tool, but a source of information for strategic decision-making. Companies can use this information to:
Set competitive rates: Adjust rates per mile to cover all costs and generate an adequate profit margin.
Select loads: Reject loads that, although they generate revenue, do not cover their operating costs.
Optimize the fleet: Decide whether it is more profitable to keep a vehicle in service or sell it, based on its ability to generate sufficient revenue to cover its fixed costs.
Negotiate with customers: Use route profitability data to justify rate increases or the inclusion of additional charges for special services.
Conclusion
Calculating the true profitability of a transport route requires going beyond the simple cost per mile. By integrating fixed costs, variable costs, deadhead miles, and driving times, transport companies can obtain a more accurate view of their profitability and make more informed decisions. In an environment of rising costs and narrow margins, this analytical capability is essential for long-term survival and growth. Fleet management software and telematics tools are key allies for collecting the necessary data and automating the analysis process, allowing fleet managers to focus on the strategic optimization of their operations.
Structure a professional construction budget by defining the scope, organizing the 12 essential items, and applying precise contingency ranges (5-10% for new builds, 15-25% for rehabilitation) to protect profitability and minimize financial deviations.
Designing a digital financial institution requires balancing technological innovation with profitability and regulatory compliance. This guide analyzes three key business models—Bank as a Platform, Bank as a Service, and Product Leader—and explains how to integrate measurable sustainability goals, using CaixaBank's strategic framework as a reference for green capital mobilization and financial inclusion.
Booking platform (OTA) commissions are just the tip of the iceberg. This analysis provides a method to audit the real Customer Acquisition Cost (CAC), integrating hidden costs such as price erosion and the loss of customer data, to optimize the net profitability of the accommodation.