
Guide · 18.11.2026
How to submit and track a business registration in France
Prepare documents for France’s Guichet unique, check the signature and fees, and respond if the reviewing authority asks for a correction.
Read storyUseful journalism to understand, manage and grow a business.
SearchThe UN Statistics Division’s SDG portal brings together indicators and metadata, but figures may have different producers, methods, and reference years. This guide explains how to identify those differences and when to use the UNDP’s HDI or other measures.

United Nations statistics do not come from a single body. Distinguishing who coordinates indicators, who is responsible for their methodology, and who produces the data helps prevent misleading comparisons and imprecise attribution.
The United Nations Statistics Division (UNSD) maintains the global Sustainable Development Goal (SDG) indicator portal, its associated database, and the metadata repository. Its role includes organizing and facilitating access to comparable information; this does not mean that the Division collects every data point directly or is the sole producer of all statistics across the UN system.
Global SDG indicators rely on a network of custodian agencies. Depending on the topic, a specialized international agency or organization may coordinate the methodology, collect data, calculate estimates, or prepare aggregates. National data may come from a country’s statistical office or another official administrative system; in some cases, the custodian agency adjusts it to improve international comparability or estimates values when observations are missing. As a result, a figure published in a UN database may differ from the national statistic: consult the specific method and source rather than assuming that one automatically replaces the other.
Regional commissions have a different role. The United Nations Economic Commission for Europe (UNECE) is one of the UN’s five regional commissions. In its region, it works with countries and organizations on statistical standards, methodologies, and capacity development. It is not the sole producer of UN statistics, and its regional cooperation should not be confused with calculating all regional aggregates. These may be prepared for SDG reports using national data and methods defined by the responsible agencies.
The United Nations Development Programme (UNDP), for its part, publishes the Human Development Index (HDI) as part of its human development reports. The index summarizes average achievements across three dimensions: health, education, and standard of living. It combines life expectancy at birth, schooling indicators, and gross national income per capita, which are transformed and aggregated using a geometric mean.
The HDI helps compare dimensions of development that income alone does not show, but it does not directly measure poverty or inequality within a country. The same average value can coexist with substantial differences between groups or territories. To study poverty or distribution, use specific measures and, where relevant, complementary UNDP indices and other disaggregated indicators.
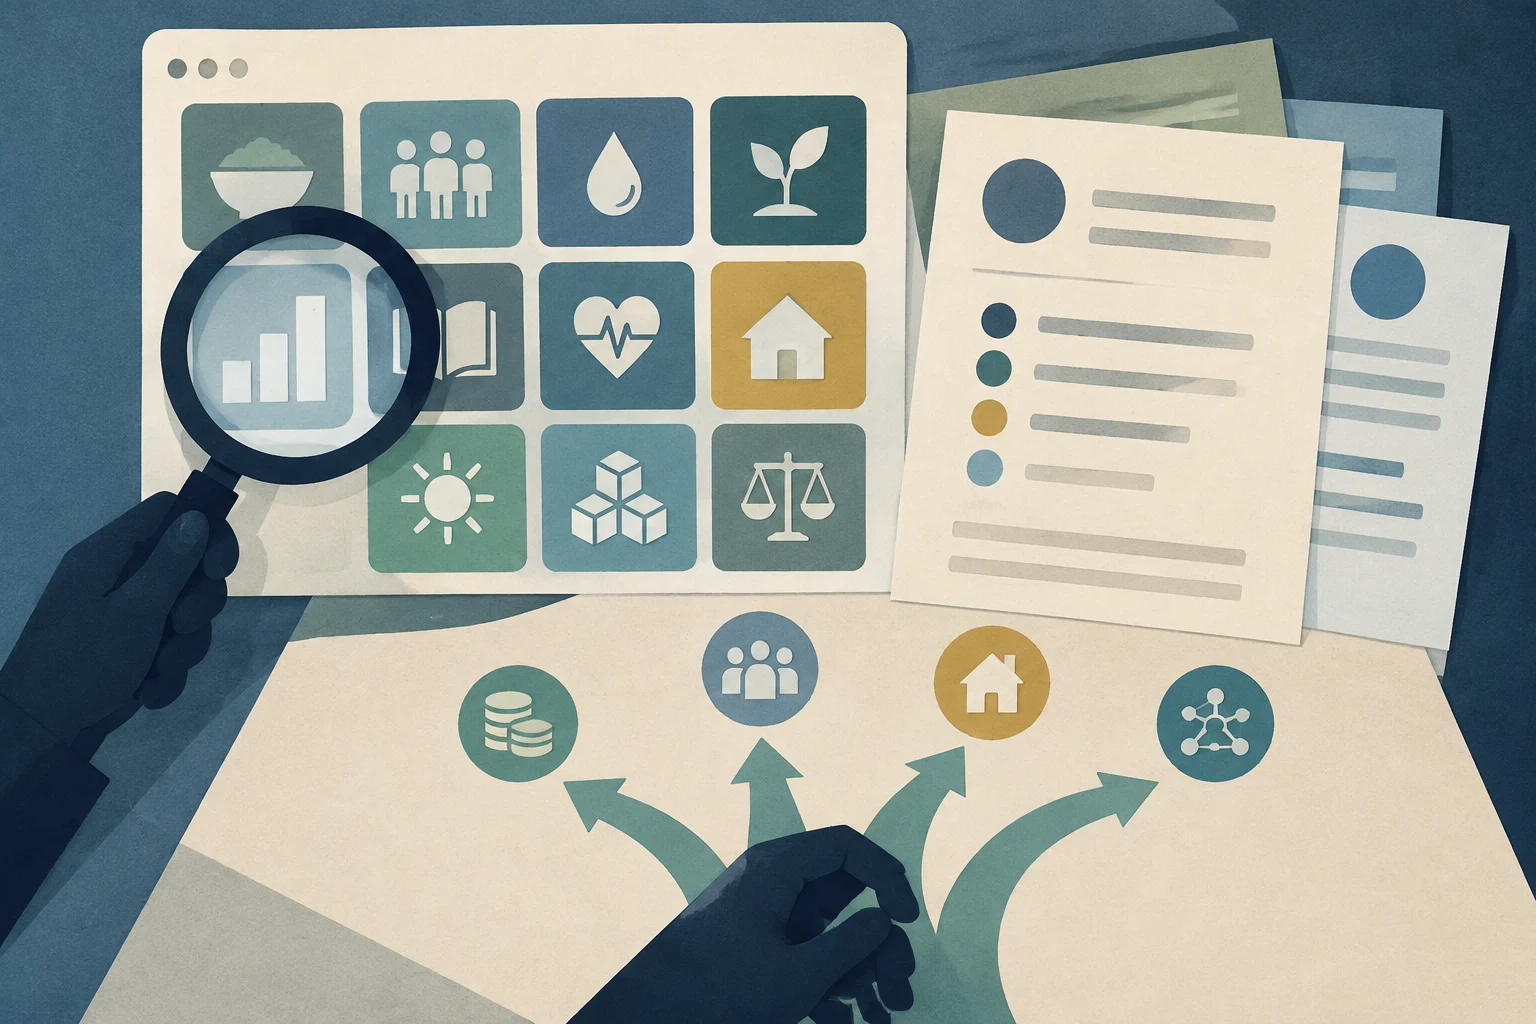
The UNSD’s SDG indicator portal lets users search by goal, target, or indicator and consult both available values and their metadata. It is a practical starting point for finding measures of poverty, basic services, employment, income distribution, and inequality, among other topics.
Start with the business question, not the figure that is easiest to find. For example, when analyzing monetary poverty, decide whether you need an internationally comparable line, the national threshold that guides local policy, relative poverty in relation to median income, or a multidimensional measure. These are not different versions of the same variable: they answer different questions.
The metadata catalogue explains how each indicator is defined and calculated, which population it covers, which sources inform it, and which breakdowns are planned. Methodologies may be updated. So, before downloading a series or automating its use, check that the metadata correspond to the version applicable to the data you are consulting. The portal’s own documentation notes that it may be undergoing updates and review.
A label such as “poverty,” “inequality,” or “development” is not enough to establish what a value means. Check at least the following:
This check helps prevent, for example, comparing a national poverty figure based on the cost of a local basket with an international line expressed in purchasing power parity. Even if both are shown as money per day, their thresholds and purposes may differ.
National poverty lines are established using criteria specific to each country and are usually linked to local needs and prices. They are useful for studying national policies but do not necessarily allow countries to be ranked directly. International lines aim to facilitate cross-country comparisons and are usually expressed in dollars adjusted for purchasing power parity (PPP).
PPP takes into account that the same amount of money buys different quantities of goods and services in different countries. It is not the same as converting currencies at the market exchange rate. When interpreting an international line, record its amount and the PPP price round or year: an update can change the real threshold and recalculate the historical series. Do not mix values from different rounds without checking whether the source has harmonized them.
Also distinguish absolute and relative poverty. A relative measure, such as the proportion of people whose income is below a fraction of the national median, depends on the country’s income distribution and may change differently from an absolute poverty line. Multidimensional indicators, in turn, combine deprivations in areas specified by a methodology; they are not equivalent to counting people who fall below a monetary threshold.
A national value may conceal differences between areas and groups. If the indicator allows it, examine the available breakdowns by sex, age, geographic location, and other relevant characteristics. The absence of a breakdown does not prove that there is no difference: it may mean that comparable or sufficient data to estimate one are unavailable.
Regional aggregates offer a way to observe broad trends, but they do not describe each country on their own. In general, aggregates in SDG reports may be weighted averages of national data and may rely on adjustments or estimates from specialized agencies. The population used for weighting, the availability of observations, and the composition of the regional group all affect the result. An average can change even if the situation in some countries remains stable, and it can conceal substantial internal differences.
Also check how the region is defined. UNSD geographic groups, groupings used by a thematic agency, and analytical groups in a report do not necessarily coincide. A regional commission’s cooperation on standards or capacity does not, by itself, determine which countries are included in a regional aggregate.
Series may be revised when new data become available or a methodology changes. As a result, the figure published today for an earlier year may differ from the one consulted at the time. When comparing periods, confirm that the series uses a consistent methodological basis and record the download date and metadata version. If observations cannot be harmonized, clearly identify the break rather than interpreting the change as a real trend.
Imagine that a company wants to compare the need for access to a basic service in two countries before designing a program. If it directly compares one country’s national poverty rate with the other country’s rate calculated using an international line, it could attribute the difference to a different level of need when part of it is due to how the indicator is defined.
A more robust analysis would first identify whether the decision requires a comparison of monetary poverty or of a specific deprivation related to the service. It would then check the metadata, reference years, sources, and coverage; use the same definition wherever possible; and review the available geographic breakdowns. If the measures are not equivalent, they could be presented in separate columns, with an explanation of the question each answers, instead of creating a single ranking.
Before incorporating a statistic into a report, model, or investment decision, record the following:
This preserves the data’s traceability and helps prevent differences that may result from distinct definitions, revisions, or coverage from being presented as economic or social differences. The figure is only the starting point: its usefulness depends on knowing exactly what it measures and what it leaves out.
Prepare documents for France’s Guichet unique, check the signature and fees, and respond if the reviewing authority asks for a correction.
Read story
A first guide to starting a business in Germany. Check which steps may apply, make a cash forecast and find advice in Mössingen and Unterallgäu.
Read story
A practical guide for site directors and prevention technicians on the drafting, approval, and updating of the Health and Safety Plan (HSP) in Spain. It analyzes the difference from the Safety Study, the legal requirements of Royal Decree 1627/1997, and protocols for serious risks.
Read story