How to calculate shrinkage and waste costs in the agri-food supply chain
A practical guide to identifying, quantifying, and reducing product losses in storage, transport, and processing. Learn how to convert percentages into real financial impact and apply management tools to improve profitability.
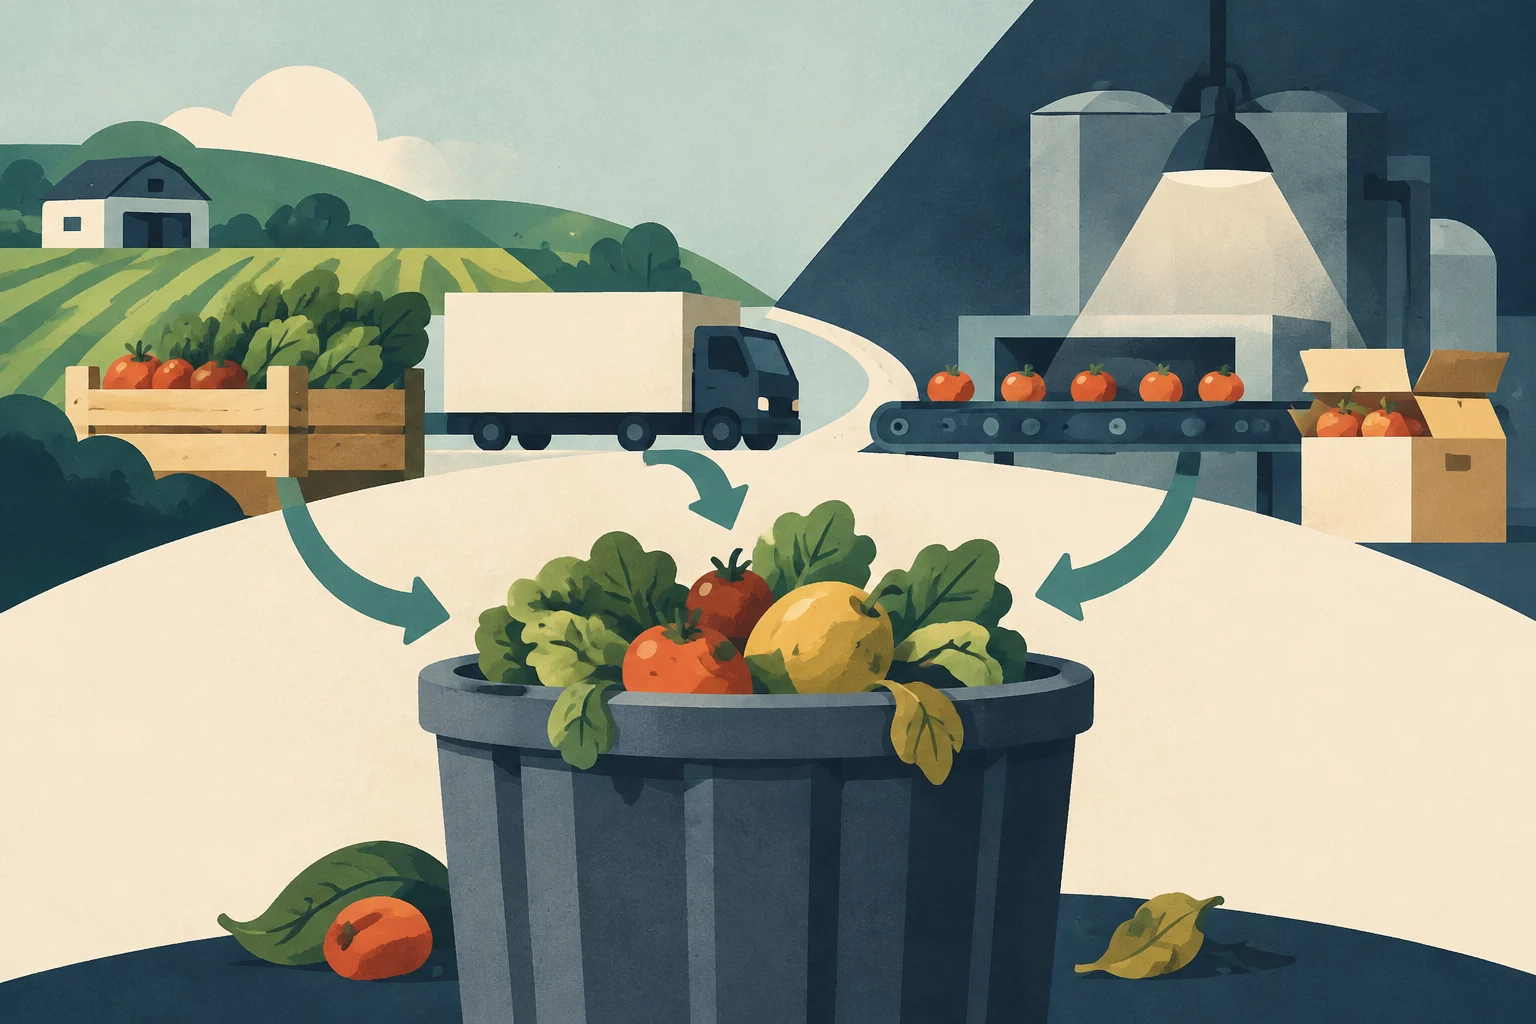
In the agri-food industry, shrinkage is not just a physical loss of product; it is a direct leakage of value that impacts operating margins. It is defined as the deviation between the expected consumption of materials and the actual consumption, manifesting as a loss of weight, volume, or quality during the storage, transport, and processing phases.
Rigorous control of these losses is fundamental because every kilogram wasted represents a hidden cost in resources, energy, and time that does not reach the end customer. According to industry data, nearly 80% of agri-food SMEs do not measure their shrinkage systematically, highlighting a wide margin for improvement. Reducing these losses acts as a direct lever on profitability, allowing companies to improve results without needing to increase sales volume.
Types of shrinkage: natural, technical, and avoidable
To manage losses effectively, it is essential to classify them according to their origin. This distinction allows for the application of the correct strategies, as not all shrinkage can be reduced in the same way.
Natural shrinkage
These are inevitable losses derived from the nature of the material itself or from physical and chemical processes. In the food industry, this includes the evaporation of liquids during cooking, drying, or moisture loss in fresh products. This type of shrinkage is considered standard and should be established as a baseline reference in cost calculations.
Technical shrinkage
This is generated by inefficiencies in production processes or machinery failures. Typical examples include the poor adjustment of a cutting machine, packaging defects, or unplanned stops in the production line. Technical shrinkage can be minimized through preventive maintenance of equipment and the optimization of process parameters.
Avoidable shrinkage
This is the type that can be prevented through better operational management. It includes losses due to overproduction, improper handling of materials, human errors, expiration due to poor inventory rotation, or even theft. This is the type of shrinkage with the greatest potential for immediate reduction and is usually the main focus of efficiency audits.
Editorial illustration · Edition Business
From gross weight to monetary cost: the calculation method
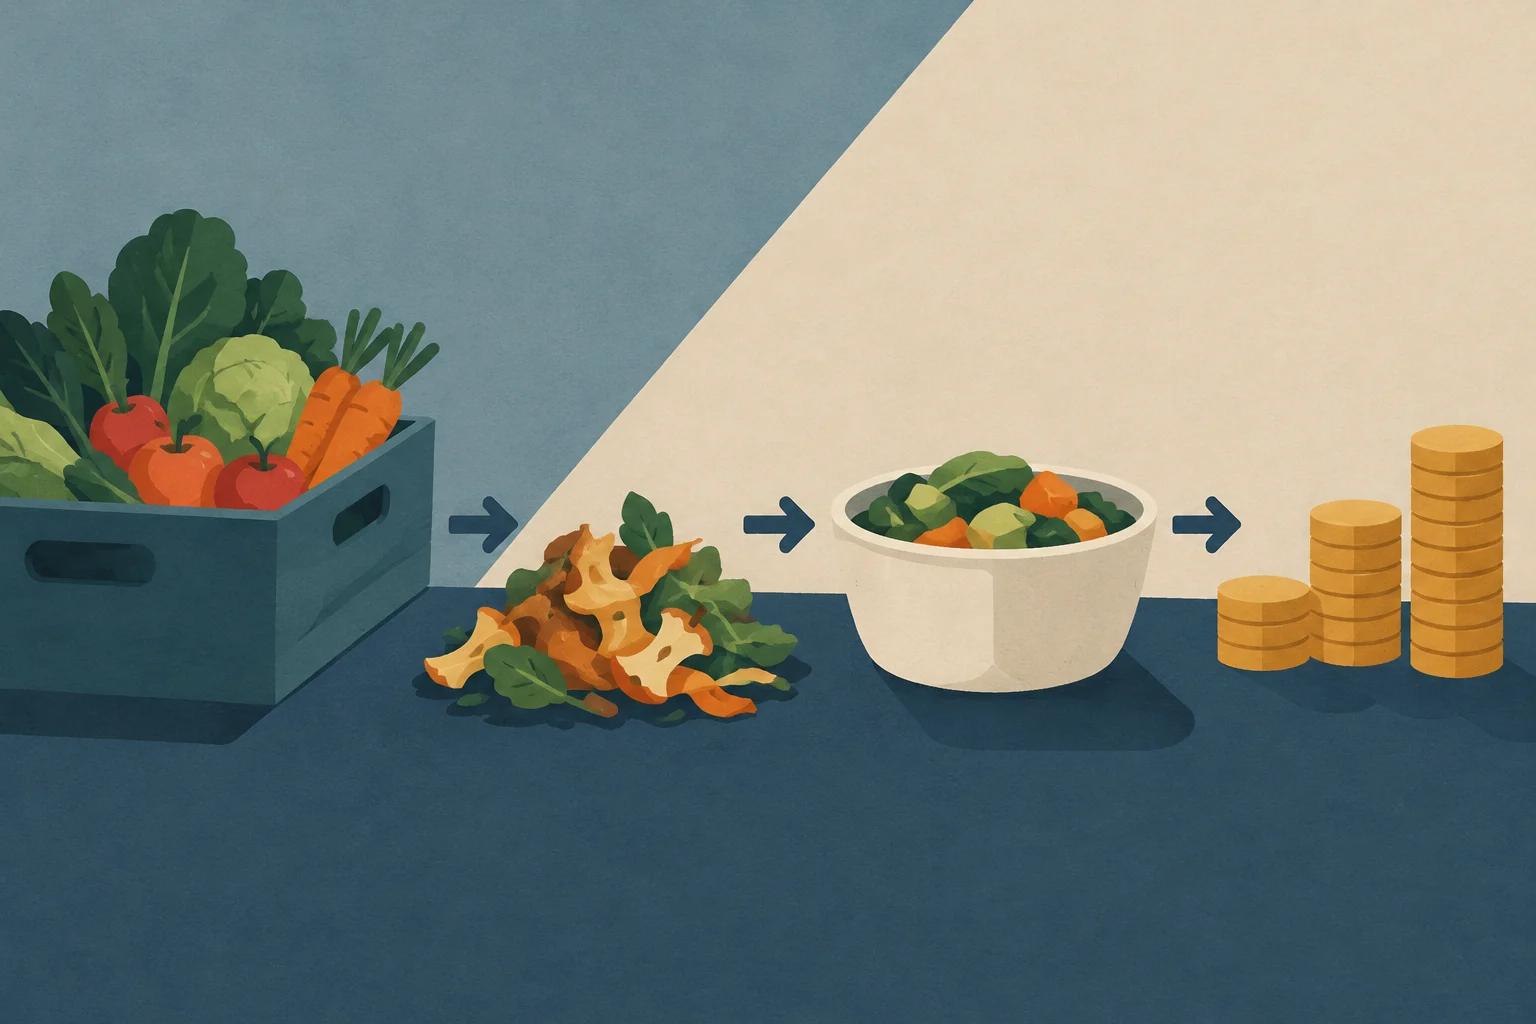
The most common error in cost management is working with the purchase price without adjusting for actual yield. To calculate the effective cost of raw materials, one must move from gross weight (what is purchased) to net weight (what is served or processed).
Steps for calculation in the recipe cost sheet
Component inventory: List all ingredients or materials necessary for the final product.
Gross weighing: Record the weight or volume as the material is received, before any processing.
Shrinkage weighing: Separate and weigh the waste, trimmings, or unusable parts.
Once the yield is obtained, the real cost per unit of raw material is calculated by dividing the purchase cost by the usable net weight. This data is crucial for setting selling prices that cover expenses and generate the desired margin.
Financial impact on the income statement
Converting the shrinkage percentage into euros allows for visualizing the real impact on the business. The basic formula is:
$$€\ lost = Food\ Purchases \times Shrinkage\ Percentage$$
If the exact purchase data is not available, it can be estimated through food cost:
For example, if a restaurant generates €40,000 in monthly revenue, has a food cost of 30%, and a shrinkage rate of 5%, the monthly loss due to waste would be €600. Annually, this represents a leakage of €7,200 that could have been converted into profit.
Tools and management systems
Manual measurement is insufficient to detect patterns and improve sustainably. The adoption of digital tools and structured methodologies is key to moving from reaction to prevention.
Manufacturing Execution Systems (MES)
MES allow for the registration of production data in real time, linking the quantities of raw materials consumed with the units of final product obtained. This facilitates the immediate detection of deviations from defined standards and allows for the analysis of the root causes of technical shrinkage.
Digital recipe cost sheets and traceability
The use of management software for cost recipe sheets allows for the automatic updating of selling prices when raw material costs or yield change. Furthermore, data traceability allows identifying whether high shrinkage is due to a specific supplier, a specific batch, or a recurring operational error.
Process standardization
Variability in processes is one of the biggest generators of shrinkage. The standardization of recipes, cooking times, and cutting techniques reduces dependence on the individual skill of each operator and guarantees consistent yield. Continuous staff training complements technology, ensuring that best practices are applied on a daily basis.
Action plan for shrinkage reduction
Implementing effective shrinkage control requires a structured approach. Below are the key steps to transform the problem into an improvement opportunity.
Process mapping: Identify at which stages (reception, storage, processing, service) the greatest waste is generated.
Establishment of baselines: Measure current shrinkage over a period of time to have an objective reference.
Definition of objectives: Set realistic reduction goals, aligned with the company's financial objectives.
Cause analysis: Use tools such as the Ishikawa diagram to distinguish between natural, technical, and avoidable shrinkage.
Implementation of corrective actions: Adjust machinery, review processes, improve inventory rotation (FIFO), and train staff.
Continuous monitoring: Periodically review yield and shrinkage KPIs to ensure the sustainability of improvements.
Defining what is certified, how the billable amount is calculated, and when payment is due helps prevent duplicate charges, measurement disputes, and cash-flow pressures on construction projects.
A reliable estimate adds employer costs and other expenses to wages, divides the total by the hours actually spent on productive work, and adjusts the result to the productivity of each work item and its indirect costs.
A practical guide to turning a small business’s records into an income statement, a balance sheet, and a historical statement of cash flows—and checking that the figures tie together.