
Guide · 18.11.2026
How to submit and track a business registration in France
Prepare documents for France’s Guichet unique, check the signature and fees, and respond if the reviewing authority asks for a correction.
Read storyUseful journalism to understand, manage and grow a business.
SearchA practical method for comparing weekly demand with in-house capacity, calculating when a permanent vehicle is justified, and choosing whether to optimize, rent, or subcontract during peak periods.

Sizing a fleet for a seasonal campaign does not mean adding vehicles “just in case,” but covering forecast demand without turning a temporary peak into year-round fixed costs. To start, bring weekly demand and capacity actually available together in one view.
Record orders, tonnes, or pallets per week; the busiest days; origins and destinations (O/D); delivery windows; and any special load requirements. In parallel, count vehicles by type, usable shifts, available drivers, and the proportion of operational units. A fleet’s nominal size does not necessarily equal the same capacity on the road: maintenance, breakdowns, and staff availability can reduce it.
It is useful to segment data by shift, location, and vehicle class. A monthly average can hide, for example, a shortfall concentrated on a few days or on a route requiring specialized equipment. Telematics and operational records can help verify mileage, hours of use, waiting times, and empty runs; their usefulness depends on the data being recorded consistently.
Before adding permanent capacity, estimate the minimum utilization that would justify the asset compared with a flexible alternative. The threshold can be measured in kilometers or hours, depending on the type of operation. For a transport fleet, one indicative formula is:
The result indicates how many kilometers generating sufficient margin would be needed to cover the weekly fixed cost, according to the assumptions used. It is neither a rate nor a guarantee of profitability: the calculation must compare equivalent items and reflect the company’s costs and margins. If some vehicles work mainly by the hour, it is more appropriate to calculate the threshold using that unit.
For the comparison to be useful, include the relevant fixed costs and define what “net margin per kilometer” means in your analysis. Add variable costs that change with usage separately, and allow for a prudent operating margin; the sources do not set a universal figure for that margin. Recalculate the threshold by vehicle type, route, or season when conditions differ.
Next, compare each unit’s forecast utilization with its threshold. If a vehicle would not reach the minimum during the campaign, keeping it as fixed capacity could leave costs uncovered outside the period of activity. If demand exceeds in-house capacity and forecast usage justifies the asset on an ongoing basis, adding it permanently warrants a broader economic analysis; the threshold alone does not resolve that decision.
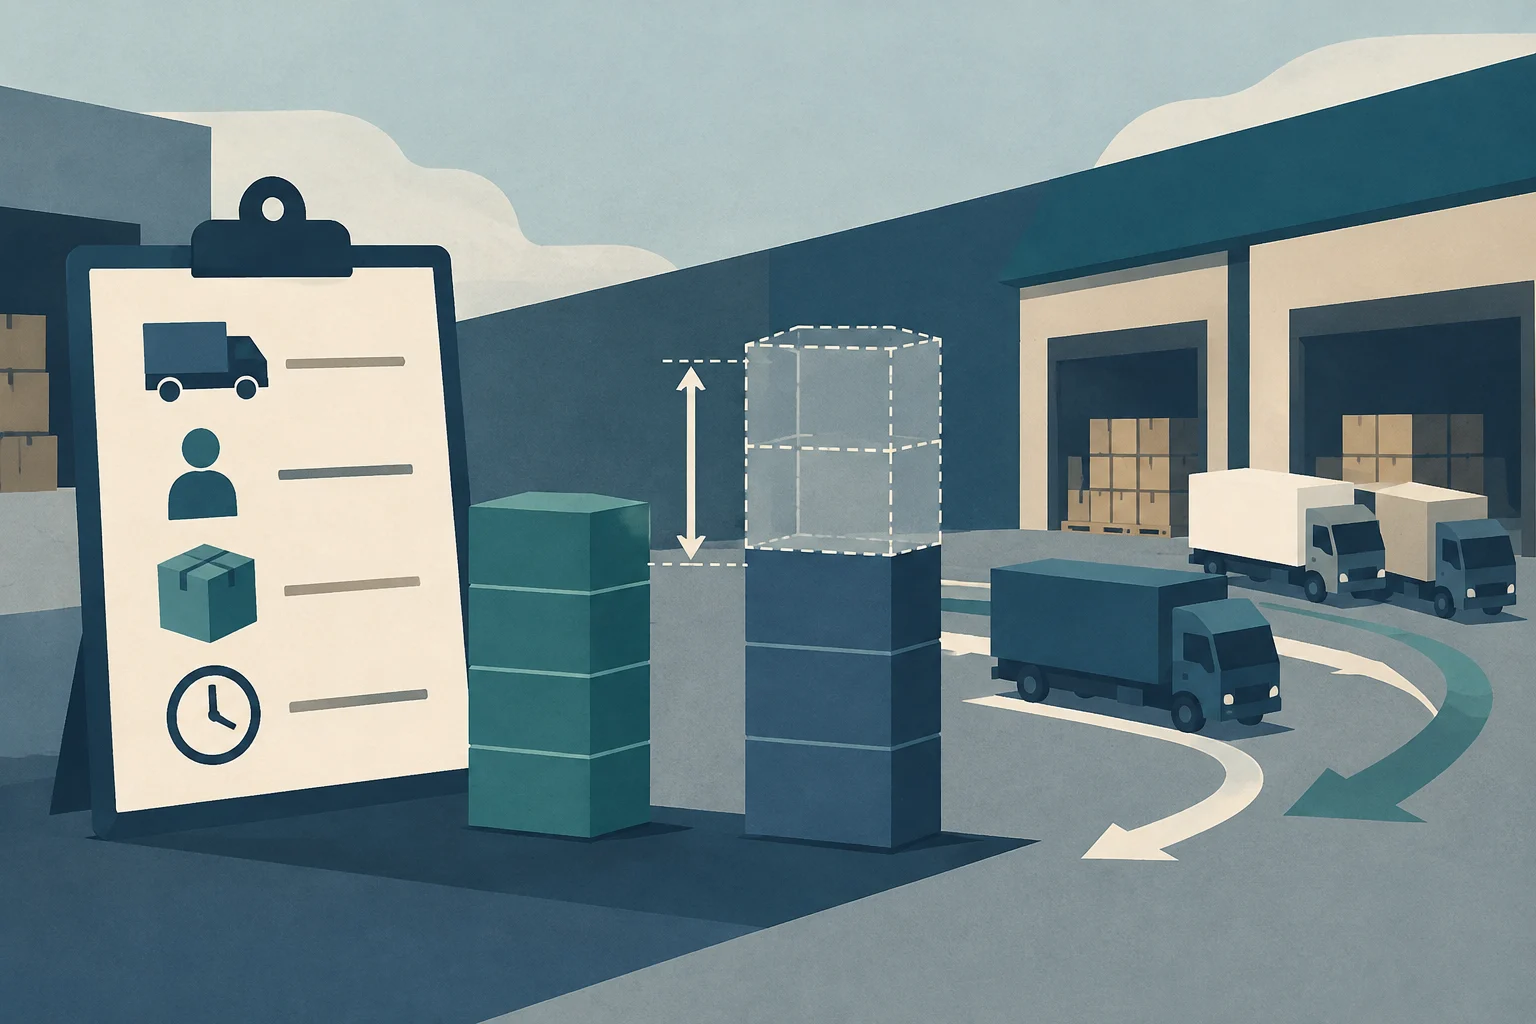
Calculate the capacity gap by week and shift: forecast demand minus usable in-house capacity. Do not use the number of vehicles alone. Also check whether drivers are available, whether vehicles are suitable for the load, and whether delivery windows allow the volume to be handled.
Before covering the entire gap with more trucks, review utilization, dock times, and empty miles. Route optimization and better load coordination can free up existing capacity and reduce unproductive mileage. However, these adjustments do not replace vehicles or drivers that the operation genuinely needs to meet service commitments.
The decision between an in-house fleet and external capacity depends on the peak’s duration, the specialization required, driver availability, and the total cost for a comparable route and load.
Compare the options on the same basis: cost per kilometer or per order, expected service level, and operational requirements. An option that appears cheaper may not be equivalent if the load, route, punctuality, or type of vehicle differs.
A capacity plan only works if vehicles are available when needed. Schedule preventive maintenance, keep records up to date, and assign people to confirm availability before each week of peak activity. Telematics can provide information on location and usage, while management systems help organize routes and alerts; no tool replaces data validation or operational review.
During the campaign, track a short set of indicators using consistent definitions:
Very high utilization is not always desirable: leaving little spare capacity can make it harder to absorb breakdowns, incidents, or changes in demand. Review the indicators by week and shift, and compare what happened with the forecast. This review makes it possible to adjust the next campaign using the company’s own data instead of sizing the fleet solely on averages or impressions.
Prepare documents for France’s Guichet unique, check the signature and fees, and respond if the reviewing authority asks for a correction.
Read story
A first guide to starting a business in Germany. Check which steps may apply, make a cash forecast and find advice in Mössingen and Unterallgäu.
Read story
A practical guide for site directors and prevention technicians on the drafting, approval, and updating of the Health and Safety Plan (HSP) in Spain. It analyzes the difference from the Safety Study, the legal requirements of Royal Decree 1627/1997, and protocols for serious risks.
Read story